Engagement & Retention project | Swiggy
1. Understand the Product
Background
Timeline Evolution
Founded in 2014 by Sriharsha Majety, Nandan Reddy, and Rahul Jaimini, Swiggy started as a food delivery platform in Bangalore with just 25 restaurants and 6 delivery partners. By 2015, they raised their first significant funding of $16.5M and expanded to multiple cities. The 2017-2019 period marked aggressive expansion to 100+ cities and the launch of Swiggy Access (cloud kitchens). The pandemic years (2020-2022) catalyzed diversification with Instamart's launch, transforming Swiggy from a food delivery platform to a convenience tech player. By 2023, they achieved a valuation of $10.7B, commanding around 45% of India's food delivery market with operations in 500+ cities, backed by extensive funding from Prosus, SoftBank, and other major investors.
M&A and IPO Journey
Swiggy's strategic acquisitions include Scootsy (premium delivery) in 2018 for ₹50 crore, enhancing their premium delivery capabilities in Mumbai. They acquired Supr Daily (subscription-based delivery) in 2018 for grocery delivery expertise, though later scaled down operations. In 2019, they purchased Kint.io for AI capabilities. While competitors like Zomato went public, Swiggy had maintained its private status, preparing for an IPO. Swiggy's 11327 crore IPO is here now as I write this project.
Future Growth Trajectory
Swiggy's future potential lies in three key areas: First, the quick commerce revolution through Instamart, projected to be a $5B opportunity by 2025. Second, geographic expansion into Tier 2/3 cities with modified business models and local partnerships. Third, technological advancement through AI/ML integration for personalization, efficiency, and innovative services. The company is positioned to evolve from a delivery platform to an integral part of urban Indian lifestyle, with potential expansion into financial services, local services, and deeper integration into daily consumer needs. The focus on profitability, coupled with their strong tech infrastructure and brand trust, suggests a transition toward a super-app ecosystem, competing not just in food delivery but in the broader digital consumer services space.
Core Value Proposition
"Deliver Convenience & Delight On-Demand"
Value Proposition Components
Component | Description | Delivery Method |
Convenience | Eliminate effort in food acquisition | • 30-min delivery • No minimum order • Saved preferences |
Choice | Access to city's food variety | • 10,000+ restaurants • Multiple cuisines • Price ranges |
Control | Power over food decisions | • Real-time tracking • Customization options • Scheduled delivery |
Trust | Reliable service & quality | • Partner curation • Safety standards • Support system |
Problem Solution Matrix
Customer Problem | Swiggy Solution | Value Created |
Time Constraints | 30-minute delivery | Time saving & efficiency |
Limited Access | Wide restaurant network | Choice & variety |
Quality Concerns | Partner curation & ratings | Trust & reliability |
Decision Fatigue | Smart recommendations | Convenience & personalization |
Inconsistent Experience | Standardized service | Reliability & predictability |
Key Features & Benefits
Feature | Direct Benefit | Indirect Benefit |
Live Tracking | Real-time visibility | Reduced anxiety |
Multiple Payment Options | Transaction convenience | Financial flexibility |
Rating System | Quality assurance | Community trust |
Subscription (ONE) | Cost savings | Loyalty rewards |
Multi-restaurant Orders | Variety access | Social satisfaction |
Customer Insights
Voice of Customer Analysis
Aspect | Customer Quote | Underlying Value |
Convenience | "I can get food while working" | Time efficiency |
Selection | "All my favorites in one app" | Choice freedom |
Reliability | "I know exactly when it'll arrive" | Peace of mind |
Experience | "Ordering is so seamless" | Ease of use |
Value | "Savings make it worth it" | Cost efficiency |
Brand Perception
Attribute | Customer Description | Strategic Implication |
Speed | "They're always on time" | Operational excellence |
Trust | "Never disappoints" | Quality consistency |
Innovation | "Always adding new features" | Progressive improvement |
Service | "Great customer support" | Customer centricity |
Value | "Worth the premium" | Price-value balance |
Value Synthesis
Tangible Benefits
Benefit | Measurement | Impact |
Time Saved | 45+ mins per order | Productivity gain |
Choice Range | 10,000+ restaurants | Decision freedom |
Cost Savings | 15-30% with ONE | Financial benefit |
Quality Assurance | 4.2+ rated partners | Risk reduction |
Delivery Speed | 30-min average | Immediate gratification |
Intangible Benefits
Benefit | Expression | Value Creation |
Peace of Mind | "Food will arrive hot" | Emotional comfort |
Social Status | "Premium restaurant access" | Prestige |
Freedom | "Eat what I want, when I want" | Control |
Trust | "Reliable service" | Confidence |
Community | "Part of food culture" | Belonging |
How do users currently experience the core value prop repeatedly?
Journey Emotional Map
User's Emotional Journey
section Discovery
App Install: Curious
Browse: Interested
Restaurant Selection: Excited
section Ordering
Menu Exploration: Engaged
Cart Building: Focused
Payment: Cautious
section Waiting
Order Confirmation: Relieved
Tracking: Anxious
Delivery: Delighted
section Post-Order
First Bite: Satisfied
Review: Engaged
Reorder Consider: Positive
Key Touchpoint Analysis
Touchpoint | Emotional State | Value Delivery | Optimization Opportunity |
Restaurant Discovery | Excitement | Choice abundance | Personalization |
Order Placement | Anticipation | Convenience | Process streamlining |
Tracking | Engagement | Control | Anxiety reduction |
Delivery | Relief | Fulfillment | Experience enhancement |
First Bite | Satisfaction | Core value | Quality assurance |
Value Realization Points
Stage | Value Moment | Enhancement Opportunity |
Pre-Order | Restaurant discovery | AI-powered recommendations |
Ordering | Seamless checkout | One-click reordering |
Waiting | Real-time tracking | Engaging updates |
Delivery | On-time arrival | Celebration moments |
Post-Order | Quality experience | Loyalty rewards |
Friction Points and Solutions
Friction Point | Impact | Solution Approach |
Decision Paralysis | High | Smart filters & recommendations |
Delivery Anxiety | Medium | Proactive communications |
Price Sensitivity | High | Value-based pricing & subscriptions |
Quality Concerns | High | Rating system & guarantees |
Time Estimation | Medium | ML-based prediction |
Natural Frequency
1. Food Delivery (Core Product)
Casual Users
Attribute | Details | Experience Points |
Usage Pattern | 1-2 orders/month | • Special occasions • Weekend treats |
Trigger Points | • Social gatherings • Lazy weekends • Special cravings | • Restaurant discovery • Group ordering |
Value Realization | Basic convenience | • Time saving • Choice access |
Core Users
Attribute | Details | Experience Points |
Usage Pattern | 5-8 orders/month | • Weekly routines • Work lunches |
Trigger Points | • Busy workdays • Regular meals • Social dining | • Quick reordering • Saved addresses |
Value Realization | Lifestyle integration | • Meal planning • Time management |
Power Users
Attribute | Details | Experience Points |
Usage Pattern | 15+ orders/month | • Daily dependence • Multiple meals |
Trigger Points | • Daily sustenance • Team meals • Family dining | • ONE membership • Premium features |
Value Realization | Life enablement | • Complete convenience • Status & recognition |
2. Instamart (Quick Commerce)
Casual Users
Attribute | Details | Frequency |
Usage Pattern | 1-2 orders/month | • Emergency needs • Specific items |
Value Experience | Convenience backup | • Late night needs • Missing ingredients |
Core Users
Attribute | Details | Frequency |
Usage Pattern | 4-6 orders/month | • Regular supplies • Weekly needs |
Value Experience | Shopping alternative | • Time saving • Effort reduction |
Power Users
Attribute | Details | Frequency |
Usage Pattern | 10+ orders/month | • Primary shopping • Daily essentials |
Value Experience | Lifestyle dependence | • Complete convenience • Time optimization |
3. Genie (Courier Service)
Casual Users
Attribute | Details | Frequency |
Usage Pattern | 1-2 times/month | • Emergency deliveries • Special needs |
Value Experience | Emergency solution | • Problem solving • Convenience |
Core Users
Attribute | Details | Frequency |
Usage Pattern | 3-5 times/month | • Regular errands • Business needs |
Value Experience | Time optimization | • Efficiency gain • Task delegation |
Power Users
Attribute | Details | Frequency |
Usage Pattern | 8+ times/month | • Business operations • Regular needs |
Value Experience | Operations enabler | • Business efficiency • Cost saving |
Cross-Product Value Experience
Value Stacking
Product Combination | Enhanced Value | Usage Pattern |
Food + Instamart | Complete food solution | • Meal ingredients • Party supplies |
Food + Genie | Extended convenience | • Office documents • Food from non-partners |
All Products | Life management | • Daily operations • Time optimization |
Frequency Amplifiers
Trigger | Impact | Product Mix |
ONE Membership | +40% usage | Cross-category adoption |
Family Accounts | +60% orders | Multiple user needs |
Business Use | +80% frequency | Regular operations |
Value Evolution Opportunities
Current Gaps
Area | Gap | Solution Opportunity |
Integration | Siloed experiences | Unified dashboard |
Personalization | Basic recommendations | AI-driven suggestions |
Loyalty | Product-specific | Cross-category rewards |
Future Value Enhancement
Direction | Description | Impact |
Smart Bundling | Cross-product packages | Increased value perception |
Predictive Service | Anticipatory ordering | Enhanced convenience |
Lifestyle Integration | Complete life assistant | Deeper relationship |
Engagement Framework
Engagement Framework | Metrics to Track | Priority | Rationale |
Frequency | • Orders per month per user • Days between orders • Time of day distribution • Weekly active rate • Reorder rate within 72 hours • Peak vs off-peak usage | P0 | • Direct correlation with LTV and retention • Early indicator of habit formation • Predicts churn risk • Indicates product stickiness • Essential for unit economics • Primary driver of revenue growth |
Breadth | • Number of products used (Food/Instamart/Genie) • Categories ordered from • Restaurant diversity • Cuisine variety • Payment methods used • Feature adoption across products • Cross-product usage within 30 days | P1 | • Higher breadth = higher retention • Indicates platform trust • Reduces dependency risk • Shows product market fit • Predicts long-term engagement • Enables premium pricing |
Depth | • Features used per session • ONE membership adoption • Custom preferences saved • Address profiles created • Time spent per session • Cart customizations • Advanced feature usage (scheduling, group orders) • Saved payment methods | P2 | • Indicates user investment • Shows platform mastery • Predicts referral likelihood • Builds switching costs • Creates operational efficiency • Enables personalization |
Additional Context:
Frequency Thresholds
User Type | Target Frequency | Success Criteria |
Casual | 2-4 orders/month | Consistent monthly usage |
Core | 8-12 orders/month | Weekly engagement |
Power | 15+ orders/month | Multiple weekly touchpoints |
Breadth Goals
Stage | Target Products | Timeline |
Entry | 1 product mastery | First 30 days |
Growth | 2 products adoption | 90 days |
Mature | All products usage | 180 days |
Depth Progression
Level | Feature Adoption | Impact |
Basic | Core ordering features | Functional usage |
Advanced | Premium features | Value maximization |
Expert | Platform integration | Ecosystem dependence |
Defining Core EnR Metrics
Primary Actions for Active User Status
Must meet at least 3 of these 5 core criteria in a 30-day period:
Core Action
Threshold
Why it matters
Order Frequency
≥4 orders/month
Shows habitual usage
Time Between Orders
<8 days
Indicates regular dependence
Multi-Category
≥2 categories ordered from
Demonstrates platform trust
Order Completion
>70% cart-to-order rate
Shows intent and satisfaction
Session Engagement
Opens app ≥2 times/week
Indicates browsing habit
Additional actions that indicate higher engagement:
- Swiggy ONE membership is active
- Uses both food delivery + Instamart
- Has ≥3 saved addresses
- Places group/scheduled orders
- Regular weekday (non-weekend) usage
You're NOT active in the following scenario:
- 30 days between orders
- Only festival/special occasion orders
- Exclusively discount-driven orders
- Single-category usage with large gaps
Customer Segmentation
RFM Scoring Framework
Scoring Criteria
Dimension | 5 (Excellent) | 4 (Good) | 3 (Average) | 2 (Poor) | 1 (Critical) |
Recency | <3 days | 4-7 days | 8-14 days | 15-30 days | >30 days |
Frequency | >15 orders/month | 8-14 orders/month | 4-7 orders/month | 2-3 orders/month | 1 order/month |
Monetary | >₹8000/month | ₹5000-7999/month | ₹3000-4999/month | ₹1000-2999/month | <₹1000/month |
Segment Definitions
Segment | RFM Score | Characteristics | Strategy |
Champions | 555, 554, 544 | • Most recent order within 3 days • Orders >15 times/month • Spends >₹8000/month | • VIP treatment • Early access • Exclusive benefits |
Loyalists | 543, 444, 445 | • Orders within week • Regular high frequency • Good spend level | • Retention focus • Cross-selling • Premium conversion |
Promising | 535, 534, 525 | • Recent orders • Lower frequency • Medium spend | • Frequency building • Category expansion • Value demonstration |
At Risk | 323, 333, 334 | • Declining recency • Moderate usage • Average spend | • Reactivation • Problem solving • Value reminders |
Hibernating | 222, 223, 232 | • Last order >2 weeks • Low frequency • Low spend | • Win-back campaigns • New features • Special offers |
Lost | 111, 112, 121 | • Inactive >30 days • Minimal history • Lowest value | • Final win-back • Survey feedback • Cost-effective approach |
Value Generation
Segment
Revenue Impact
Characteristics
Priority
High Value
• >₹8000/month<br>• Regular orders<br>• Multiple products
• 15% of users<br>• 40% of revenue<br>• High retention
P0 - Retain & Grow
Growing Value
• ₹3000-8000/month<br>• Increasing frequency<br>• Category exploring
• 30% of users<br>• 35% of revenue<br>• Good potential
P1 - Nurture & Upgrade
Basic Value
• ₹1000-3000/month<br>• Irregular usage<br>• Single category
• 40% of users<br>• 20% of revenue<br>• Mass segment
P2 - Activate & Convert
Low Value
• <₹1000/month<br>• Rare usage<br>• Discount dependent
• 15% of users<br>• 5% of revenue<br>• High churn risk
P3 - Evaluate & Filter
ICPs
Dimension | Time-Starved Neha | Busy Parent Priya | Budget-Conscious Kaushik | Double-Income Duo (Dev & Aishwarya) | Enterprise Entrepreneur Shreyansh |
Age & Life Stage | 25-35, Single/Early Career | 32-45, Married with Kids | 18-24, Student | 28-35, DINK Couple | 35-50, Established Professional |
Demographics | • Income: ₹12-20 LPA• Metro cities>• Post-graduate• Tech/Finance professional• Lives alone/with roommates | • Household: ₹15-25 LPA• Tier 1 & 2 cities• Graduate• 2-3 kids• Nuclear family setup | • Allowance: ₹15-25K/month• College towns• Student• Lives in hostel/PG• Shared living | • Combined: ₹20-30 LPA• Metro cities• Double professionals• No kids• Own apartment | • Business: ₹50L-2Cr revenue• Tier 1 & 2 cities• Team of 10-50• Office setup• Multiple locations |
Primary Needs | • Quick meals• Healthy options• Reliability• Quality assurance• Time savings | • Family meals• Value for money• Variety• Safe packaging• Convenient ordering | • Affordable food• Quick delivery• Late night options• Group ordering• Deals & discounts | • Premium experiences• New cuisines• Quality service• Weekend specials• Convenience | • Bulk ordering• Corporate billing• Reliable service• Quality consistency• Professional support |
Order Frequency | 8-10 times/month | 4-6 times/month | 12-15 times/month | 10-12 times/month | 15-20 times/month |
Goals | • Career growth• Work-life balance• Health maintenance• Time optimization• Quality lifestyle | • Family nutrition• Time management• Budget control• Kid-friendly meals• Occasional treats | • Good grades• Social life• Budget management• Convenience• Peer acceptance | • Lifestyle experiences• Quality time• New experiences• Social status• Convenience | • Business growth• Team satisfaction• Cost efficiency• Professional image• Time management |
Swiggy Solutions | • Swiggy ONE membership• Priority delivery• Healthy tags• Multiple payment options• Cross-category service | • Family packs• Safety assurance• Kid-friendly filters• Scheduled delivery• Multiple addresses | • Student discounts• Late night delivery• Group ordering• Split payments• Budget filters | • Premium restaurants• Priority support• Quality assurance• Experience curation• Elite membership | • Corporate account• Bulk ordering• Invoice generation• Dedicated support• Analytics dashboard |
Behavior Patterns | • Weekday lunch orders• Late dinner orders• Quick browsing• Repeat orders• Multi-category usage | • Weekend family meals• Advance planning• Menu research• Safety checks• Regular feedback | • Late night orders• Group decisions• Deal hunting• Quick ordering• Social sharing | • Weekend brunches• Date night dinners• Premium selection• Experience focus• Regular reviews | • Lunch orders• Meeting catering• Scheduled delivery• Bulk ordering• System integration |
Marketing Pitch | "Your personal food assistant - Quality meals delivered when you need them" | "Family meals made easy - Variety, value, and convenience for your loved ones" | "Great food that fits your budget and schedule" | "Curated dining experiences delivered to your doorstep" | "Professional food delivery solutions for growing businesses" |
Average Spend | ₹400-600/order | ₹800-1200/order | ₹200-300/order | ₹700-900/order | ₹1500-2500/order |
Value-Accessibility | 8/10 | 7/10 | 9/10 | 6/10 | 8/10 |
Value-Experience | 9/10 | 7/10 | 6/10 | 9/10 | 8/10 |
Pain Points | • Inconsistent quality• Delivery delays• Limited healthy options• Peak hour unavailability | • Portion size issues• Temperature control• Delivery coordination• Budget management | • Minimum order values• Limited late-night options• Split payment issues• Delivery radius | • Premium restaurant availability• Quality consistency• Special requests handling | • Order coordination• Billing complexity• Delivery timing• Quality maintenance |
Preferred Channels | • Mobile app• Email• Push notifications• Instagram | • WhatsApp• SMS• Television• Facebook | • Instagram• Snapchat• Campus marketing• WhatsApp | • Instagram• Email• In-app notifications• Premium content | • Email• Corporate portal• LinkedIn• Direct sales |
Growth Potential | • Premium features• Cross-category usage• Subscription upgrades | • Party orders• Grocery integration• Membership upgrade | • Post-college retention• Category expansion• Group subscriptions | • Premium services• Experience packages• Cross-category premium | • Multiple locations• Service expansion• Analytics integration |
Retention Strategy | • Personalized recommendations• Priority support• Health tracking• Loyalty rewards | • Family programs• Safety certificates• Kids-special menu• Family rewards | • Student discounts• Group benefits• Peer programs• Campus rewards | • Premium benefits• Experience curation• Elite status• Special access | • Volume discounts• Account management• Custom solutions• Business rewards |
Success Metrics | • Order frequency• Cross-category usage• Premium adoption• Referral rate | • Order size• Safety ratings• Family engagement• Review scores | • Group size• Deal utilization• Network effect• Retention post-college | • Premium spend• Experience ratings• Category exploration• Social sharing | • Order volume• Team satisfaction• System adoption• Business growth |
Seasonal Patterns | • Higher usage in work peaks• Month-end spurts• Late evening concentration• Weekday focus• Project deadline correlation | • School holiday patterns• Weekend family time• Festival season peaks• Vacation periods• Event-based ordering | • Exam period spikes• Semester patterns• College event correlation• Weekend socializing• Study group sessions | • Weekend/holiday focus• Travel season dips• Special occasion spikes• Event-based ordering• Social calendar alignment | • Business cycle aligned• Quarter-end peaks• Meeting patterns• Client visit correlation• Team size fluctuation |
Tech Adoption Score | 4.8/5• Early adopter• Feature explorer• Digital native• Multi-platform user• Tech trend follower | 3.5/5• Practical adopter• Safety-focused• Convenience seeker• Basic feature user• Stability preferred | 4.5/5• Tech-native• Platform switcher• Feature maximizer• Social integrator• Trend adopter | 4.7/5• Innovation seekers• Premium feature users• Experience focused• Multi-device users• Early adopters | 4.0/5• System-focused• Integration seeker• Efficiency driven• Analytics user• Process optimizer |
Loyalty Indicators | • Brand loyal if consistent• Quality-driven retention• Service sensitivity• Premium feature adoption• Cross-category loyal | • Value-driven loyalty• Safety record important• Family feedback crucial• Long-term relationship• Brand trust priority | • Deal-driven switching• Price sensitivity high• Peer influence strong• Short-term focused• Promotion responsive | • Experience-loyal• Quality-driven retention• Innovation seeking• Brand conscious• Premium service focused | • Service-loyal• Reliability dependent• Contract focused• System integration key• Professional service priority |
Future Opportunities | • Health tech integration• AI-driven preferences• Meal planning features• Wellness tracking• Professional networking | • Family meal planning• Kids ordering features• Safety tracking• Family accounts• Event planning | • Student community features• Group gamification• Campus integration• Education partnerships• Career transition program | • Premium experiences• Couple-specific features• Lifestyle integration• Social sharing tools• Experience curation | • Enterprise solutions• Team analytics• Multi-location control• Budget optimization• Client entertainment |
Platform Usage | • Mobile app: 80%• Desktop: 15%• Tablet: 5%• Peak hours: 1pm, 8pm• Feature exploration: High | • Mobile app: 70%• Desktop: 20%• Tablet: 10%• Peak hours: 6pm, 8pm• Feature exploration: Medium | • Mobile app: 95%• Desktop: 5%• Peak hours: 4pm, 11pm• Feature exploration: Medium-High• Group features: High | • Mobile app: 85%• Desktop: 10%• Tablet: 5%• Peak hours: 11am, 8pm• Feature exploration: Very High | • Mobile app: 40%• Desktop: 55%• Tablet: 5%• Peak hours: 11am, 3pm• Feature exploration: Medium |
Content Engagement | • Quick reviews• Health content• Time-saving tips• Professional networking• Lifestyle content | • Safety information• Family nutrition• Kids menu content• Parent community• Recipe sharing | • Deal alerts• Student content• Social features• Group activities• Campus news | • Food trends• Premium content• Experience stories• Lifestyle blogs• Social sharing | • Business solutions• Case studies• Analytics reports• Team management• Industry news |
Decision Drivers | 1. Time saving 2. Quality 3. Convenience 4. Health factor 5. Professional image | 1. Family preference 2. Value for money3. Safety 4. Convenience5. Portion size | 1. Price2. Deals3. Speed4. Group consensus5. Variety | 1. Quality2. Experience3. Convenience4. Innovation5. Status | 1. Reliability2. Efficiency3. Cost control4. Quality5. Professional service |
Risk Factors | • Service inconsistency• Quality variation• Time sensitivity• Health concerns• Price premium | • Safety concerns• Budget overruns• Family disagreement• Delivery timing• Quality consistency | • Budget constraints• Service variability• Group conflicts• Time pressure• Limited options | • Service gaps• Quality inconsistency• Premium availability• Experience matching• Price sensitivity | • Service reliability• Scale issues• Budget control• Quality maintenance• Team satisfaction |
Support Preferences | • Chat support• Quick resolution• Self-service• Premium support• Email follow-up | • Phone support• WhatsApp help• Voice assistance• Clear communication• Safety assurance | • Chat support• Quick fixes• Social media• Peer solutions• Group support | • Premium support• Personal assistance• Quick resolution• Quality assurance• Experience recovery | • Dedicated manager• Business support• System assistance• Professional service• Priority resolution |
Interview Insights | • "I often work late and need reliable dinner options"• "Health is important but I don't have time to cook"• "I value quick, quality service over cost" | • "Finding food that everyone likes is challenging"• "Safety and hygiene are top priorities"• "Need flexible delivery timing for family schedule" | • "Price is the main factor in decisions"• "Late night study sessions need food options"• "Group ordering is common but complex" | • "We enjoy trying new cuisines"• "Quality and experience matter more than price"• "Weekend brunches are our thing" | • "Need professional service for client meetings"• "Bulk ordering with individual customization"• "Billing and invoicing must be streamlined" |

Engagement Campaigns
Campaign 1: "Weekend Chef's Club"
Element | Details | Rationale |
Hypothesis | Premium users who explore 3+ cuisines in first month show 2x higher retention and 40% higher AOV | Data shows cuisine exploration correlates with platform stickiness |
Channel | • In-app premium section • Email newsletter • Instagram influencer partnerships • WhatsApp updates | Multi-channel approach for premium audience |
Target Persona | Time-Starved Professionals • High disposable income • Weekend cooking enthusiasts • 25-40 age group | Highest LTV potential segment |
Theme | Culinary exploration and premium dining experiences | Aligned with target persona aspirations |
Target Feature | • Premium restaurant collection • Group ordering • Scheduled deliveries | High-value feature adoption |
Pitch & Content | "Your Weekend Culinary Adventure" • Celebrity chef collaborations • Exclusive restaurant access • Behind-the-scenes content | Premium positioning and exclusivity |
Campaign Goal | Increase premium segment AOV by 30% through weekend orders | Clear, measurable objective |
Offer Details | • Free ONE membership for 3 months • ₹500 off on 3 weekend orders • Exclusive restaurant access Budget: ₹200 per conversion | Value-driven, not discount-dependent |
Frequency | • Launch: Friday evenings • 3-month campaign • Weekly exclusive drops | Aligned with target behavior |
Success Metrics | • Premium conversion rate • Weekend order value • Cuisine exploration rate • Retention post-campaign | Comprehensive measurement |
Milestones | M1 (1 month): 20% target acquisition M2 (2 months): 40% retention M3 (3 months): 30% AOV increase | Progressive tracking |

Campaign 2: "Office Hours Power"
Element | Details | Rationale |
Hypothesis | Corporate users with scheduled lunch orders show 3x higher weekly frequency | Habit formation through convenience |
Channel | • Corporate partnerships • LinkedIn ads • Email campaigns • In-office promotions | B2B focused distribution |
Target Persona | Corporate Teams • 50+ employees • Regular lunch orders • Tech companies | High volume, predictable orders |
Theme | Workplace productivity and team culture | Business value proposition |
Target Feature | • Group ordering • Corporate billing • Scheduled orders | Business-specific features |
Pitch & Content | "Transform Your Team Lunch" • Productivity benefits • Team building aspects • Cost savings | Business-centric messaging |
Campaign Goal | Acquire 100 corporate accounts with 50% becoming regular users | Clear B2B focus |
Offer Details | • 25% corporate discount • Free delivery month • Dedicated account manager Budget: ₹2000 per company | Business-appropriate value |
Frequency | • Quarterly campaign • Weekday focus • 6-month contract | Long-term relationship |
Success Metrics | • Corporate account sign-ups • Daily active users • Order frequency • Contract renewal rate | B2B metrics |
Milestones | M1 (3 months): 50 accounts M2 (6 months): 80% retention M3 (9 months): 2x volume | Progressive B2B growth |

Campaign 3: "Instamart First"
Element | Details | Rationale |
Hypothesis | Users who try Instamart within first week show 60% higher cross-category usage | Early adoption drives platform usage |
Channel | • Push notifications • In-app banners • SMS campaigns • Post-food order promotions | Multi-touch activation |
Target Persona | New Food Delivery Users • First 7 days • Urban locations • High intent signals | Early engagement opportunity |
Theme | Instant gratification and convenience | Quick commerce value prop |
Target Feature | • Instamart quick delivery • Combined cart • Cross-category rewards | Category expansion |
Pitch & Content | "Complete Your Kitchen" • Instant delivery highlight • Complementary products • Convenience focus | Need-based messaging |
Campaign Goal | 40% of new users try Instamart in first week | Clear conversion goal |
Offer Details | • ₹100 off first Instamart order • Free delivery week • Combo deals Budget: ₹150 per conversion | Trial encouragement |
Frequency | • Continuous campaign • First week focus • Daily triggers | Early engagement |
Success Metrics | • Cross-category adoption • Time to first Instamart order • Category retention • Combined cart rate | Category growth metrics |
Milestones | M1 (1 week): 20% trial M2 (2 weeks): 50% repeat M3 (1 month): 30% regular | Quick progression |

Cross-category Notification Suite
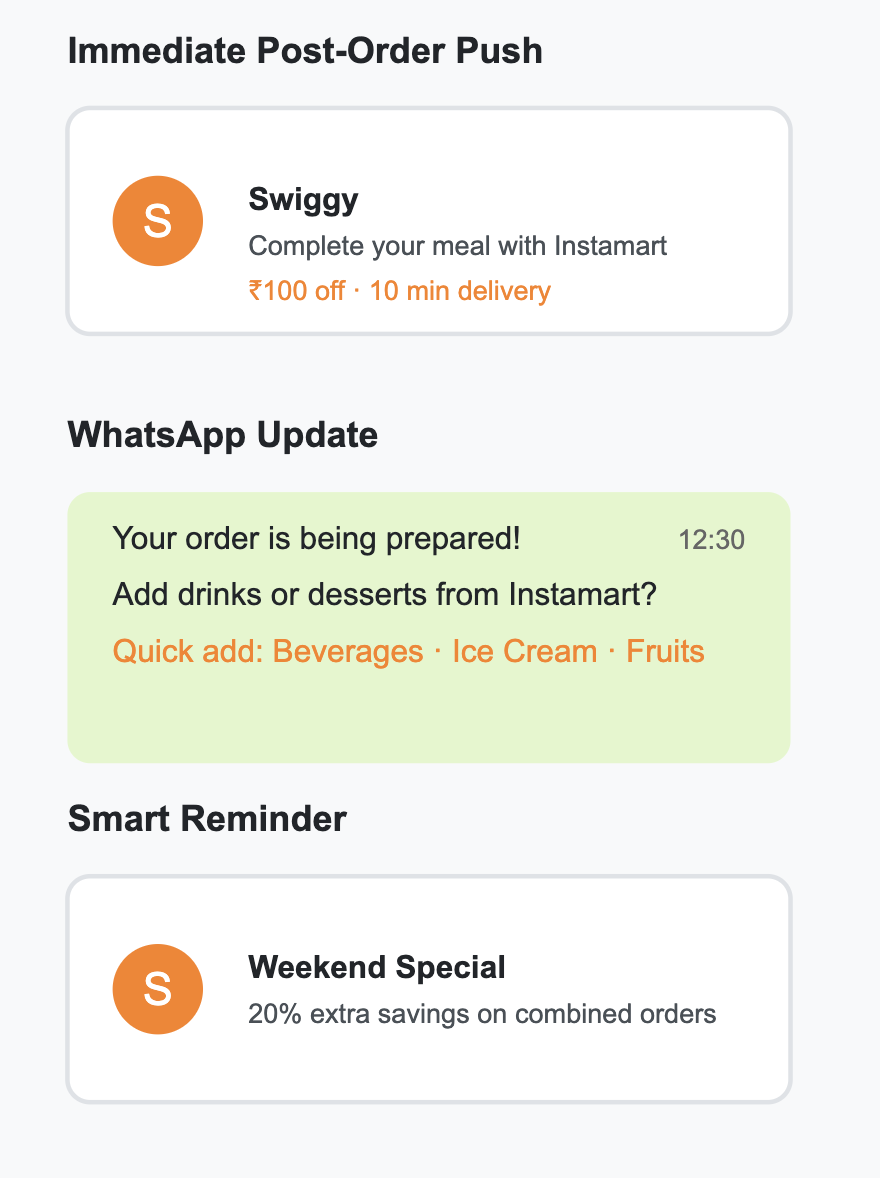
In-app premium card

Success Banner

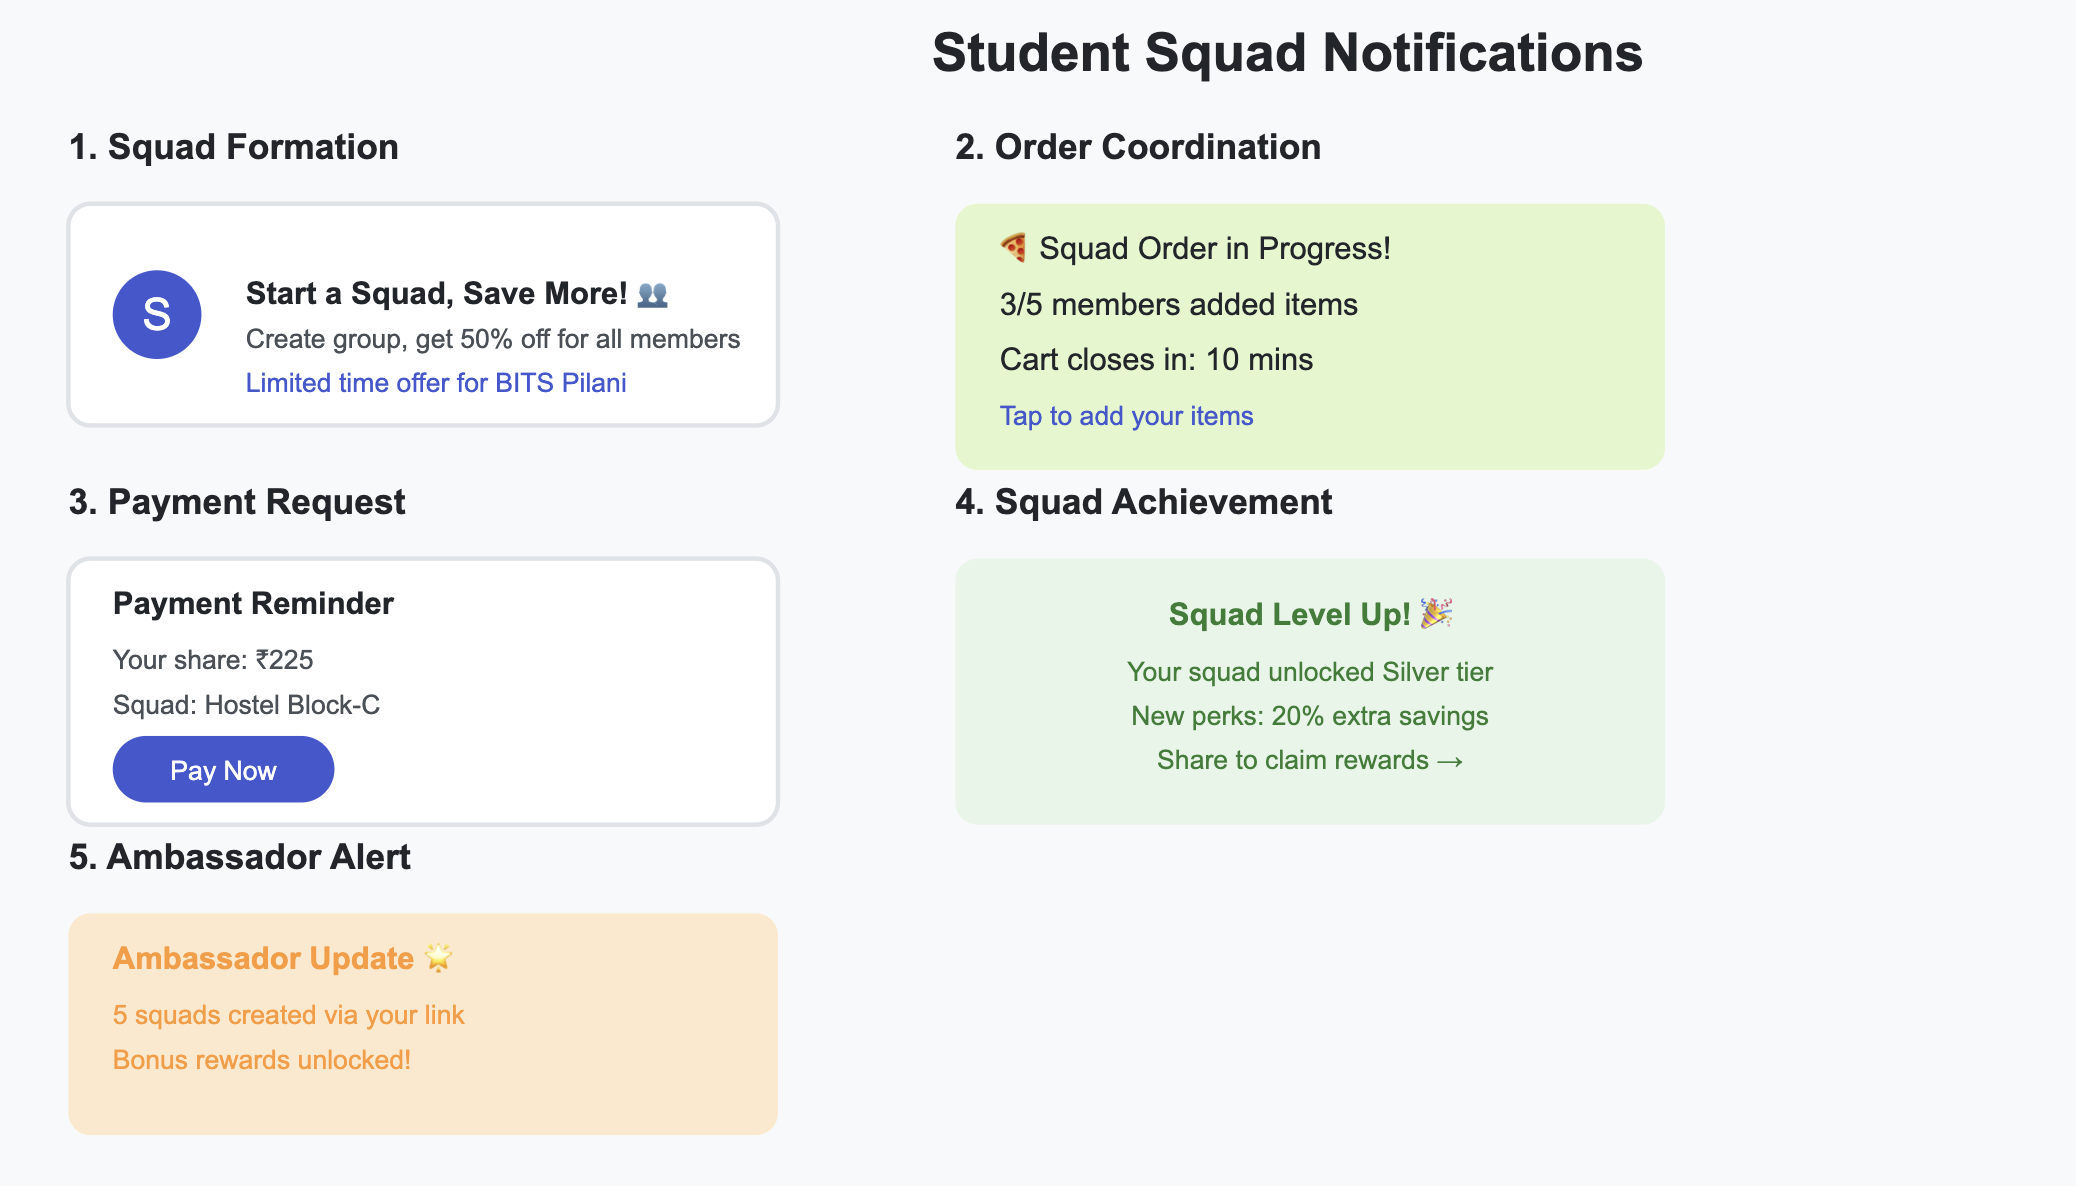
Campaign 4: "Student Savings Squad"
Element | Details | Rationale |
Hypothesis | Students with group orders show 4x higher peer referrals | Network effect in closed communities |
Channel | • Campus ambassadors • Instagram reels • College partnerships • WhatsApp groups | Youth-focused channels |
Target Persona | College Students • 18-24 age group • Hostel residents • Group orderers | High viral potential |
Theme | Social ordering and savings | Community focus |
Target Feature | • Group ordering • Split payments • Referral system | Social features |
Pitch & Content | "Squad Savings & Social Eats" • Group benefits • Social proof • Community content | Peer influence |
Campaign Goal | Increase student segment orders by 50% through groups | Community growth |
Offer Details | • 40% off group orders • Extra 10% per friend • Special hostel menus Budget: ₹100 per student | Group incentives |
Frequency | • Semester start • Weekend focus • 3-month duration | Academic calendar |
Success Metrics | • Group order volume • Referral rate • Community size • Category penetration | Community metrics |
Milestones | M1 (1 month): 30% group adoption M2 (2 months): 4 referrals/user M3 (3 months): 50% retention | Community growth |

Notification designs
 Journey

Payment Interface

Success Screens

Campaign 5: "Late Night Heroes"
Element | Details | Rationale |
Hypothesis | Night workers with consistent orders show 2x higher loyalty | Underserved time segment |
Channel | • Targeted ads (10PM-2AM) • IT park promotions • Call center partnerships • Night shift specials | Night-focused marketing |
Target Persona | Night Shift Workers • IT/BPO employees • Healthcare workers • Regular night orders | Specific time-based need |
Theme | Night shift fuel and support | Targeted solution |
Target Feature | • Night delivery • Scheduled orders • Office delivery | Time-specific features |
Pitch & Content | "Fueling Night Shift Heroes" • 24/7 reliability • Night-specific menu • Worker recognition | Emotional connection |
Campaign Goal | Double night order volume in target segments | Clear night focus |
Offer Details | • 30% off night orders • Free coffee upgrades • Night-only deals Budget: ₹180 per conversion | Night-specific value |
Frequency | • Daily (10PM-5AM) • Monthly promotions • Ongoing program | Consistent presence |
Success Metrics | • Night order volume • Time slot retention • Category growth • Corporate adoption | Time-based metrics |
Milestones | M1 (1 month): 30% volume increase M2 (3 months): 50% retention M3 (6 months): 2x night orders | Progressive growth |

Night Mode Interface

Retention Design
Retention Insights
Time Period | Overall Rate | Power Users | Regular Users | Key Insights |
Day 0 | 100% | 100% | 100% | • Installation base • App onboarding critical • First impression window |
Day 7 | 75% | 85% | 70% | • First week crucial • Initial order experience • Payment/address saved |
Day 30 | 50% | 70% | 45% | • Monthly active base • Habit formation period • Category exploration |
Day 90 | 35% | 55% | 30% | • Quarterly retention • Platform familiarity • Value realization |
Month 6 | 25% | 50% | 20% | • Loyal user base • Stable usage patterns • Category committed |
Month 12 | 20% | 50% | 15% | • Core users • Platform advocates • High LTV segment |

Major Drop Points Analysis
Phase | Drop % | Primary Reasons | Intervention Points |
D0-D7 | 25% | • Poor first experience • Value mismatch • Technical issues | • Onboarding optimization • Value demonstration • Technical support |
D7-D30 | 25% | • Lack of habit formation • Price sensitivity • Service inconsistency | • Engagement campaigns • Smart pricing • Service standards |
D30-D90 | 15% | • Alternative options • Occasion-based usage • Budget constraints | • Differentiation • Use case expansion • Value offerings |
Natural Frequency
- Food ordering has a natural daily frequency (3 meals/day) but actual usage converges to 8-10 orders/month for regular users (25-30% meal share) due to price sensitivity and alternate options, with clear usage spikes during weekday lunches and weekend dinners - this creates a baseline retention opportunity but also highlights the gap between potential and actual usage frequency.
Time to Value
- The platform delivers immediate value through 30-45 minute delivery windows, with user satisfaction heavily dependent on first order experience, but true habit formation requires 3-4 successful orders within the first two weeks - making the D0-D14 period critical for long-term retention.
Brand Value
- As a category leader alongside Zomato, Swiggy's strong brand equity is built on reliability and convenience, particularly in urban areas, with trust reinforced through features like live tracking and standardized experiences - this reduces initial adoption friction but creates higher service expectations that must be consistently met to maintain retention.
Competition
- Operating in a duopoly with Zomato and facing emerging threats from ONDC, along with renewed direct ordering options from restaurants, retention is heavily influenced by service differentiation and ecosystem lock-in (through Swiggy ONE and multi-category offerings) rather than just core food delivery performance.
Flattenting point
- The intersection of these factors creates a retention curve that typically stabilizes at 20-25% by month 6, with power users (who find alignment across frequency needs, time value, brand trust, and competitive offering) stabilizing earlier at 50-55%, while regular users fluctuate based on varying price sensitivity and alternative options - suggesting that long-term retention strategies must address multiple vectors simultaneously rather than optimizing for single factors.
Channels that drive retention
ICP-Based Channel Performance
ICP | Top Retention Channels | Retention Impact | Key Drivers |
Time-Starved Professionals | • Corporate Partnerships (65% retention) • LinkedIn Campaigns (45% retention) • Office Location Targeting (40% retention) | HIGH (50-65% average) | • Consistent weekday orders • Expense accounts • Group ordering behavior • Professional network effect • Higher LTV justifies CAC |
Family Organizers | • Facebook/Instagram Ads (35% retention) • WhatsApp Marketing (40% retention) • Community Groups (38% retention) | MEDIUM (35-40% average) | • Weekend family orders • Value-driven decisions • Word-of-mouth influence • Long decision cycles • Price sensitivity |
Student/Youth | • Instagram Reels (30% retention) • Campus Ambassadors (45% retention) • Peer Referrals (40% retention) | MEDIUM-HIGH (30-45% average) | • Group dynamics • Social validation • Deal sensitivity • High viral coefficient • Lower individual value |
Sub-Product Channel Performance
Product | Top Retention Channels | Retention Impact | Success Factors |
Food Delivery | • Push Notifications (55% retention) • Email Reminders (40% retention) • WhatsApp Updates (45% retention) | HIGH (45-55% average) | • Meal-time triggers • Order tracking • Quick reordering • Personalized recommendations |
Instamart | • In-app Cross-sell (50% retention) • Post-Order Promotions (45% retention) • Category Emails (35% retention) | MEDIUM-HIGH (35-50% average) | • Necessity purchases • Quick commerce appeal • Category discovery • Emergency needs |
Genie | • Situational SMS (30% retention) • Location-based Ads (25% retention) • Use-case Marketing (28% retention) | MEDIUM (25-30% average) | • Occasional needs • Service awareness • Emergency utility • Complementary use |
Sub-Feature Channel Performance
Feature | Top Retention Channels | Retention Impact | Engagement Drivers |
Swiggy ONE | • In-app Upsell (60% retention) • Value Demonstration (55% retention) • Benefits Notification (50% retention) | VERY HIGH (50-60% average) | • Clear value proposition • Multiple touchpoints • Savings visualization • Premium experience |
Group Ordering | • Office Email (50% retention) • WhatsApp Groups (45% retention) • Team Features (48% retention) | HIGH (45-50% average) | • Collaborative decision • Split payments • Regular usage • Team coordination |
Scheduled Delivery | • Reminder Systems (40% retention) • Calendar Integration (38% retention) • Habit Formation (42% retention) | MEDIUM-HIGH (38-42% average) | • Convenience factor • Regular patterns • Time management • Predictable service |
Understanding Churn
Top Churn Reasons (Prioritized by Impact)
Reason | % Impact | Key Indicators | Root Causes |
Service Quality Issues | 30% | • Late deliveries • Order accuracy • Food quality • Temperature issues | • Last mile challenges • Restaurant operations • Peak hour strain |
Price Sensitivity | 25% | • Cart abandonment • Reduced frequency • Deal hunting • Lower AOV | • Delivery fees • Restaurant pricing • Platform markup |
Better Alternatives | 20% | • Competitor usage • Direct ordering • Home cooking • Dining out | • Promotional offers • Service differentiation • Value perception |
Poor Experience | 15% | • App issues • Payment failures • Support problems • UI/UX friction | • Technical debt • Platform stability • Support capacity |
Changed Circumstances | 10% | • Relocation • Lifestyle change • Work pattern shift • Budget constraints | • External factors • Life events • Economic conditions |
Voluntary vs Involuntary Churn
Voluntary Churn (80% of Total Churn)
Category | Impact | Indicators | Prevention Levers |
Value-Based | High | • Price complaints • Discount seeking • Low order frequency | • Smart pricing • Value bundles • Loyalty rewards |
Service-Based | High | • Quality complaints • Delivery issues • Restaurant problems | • Service standards • Quality control • Partner management |
Experience-Based | Medium | • App feedback • Interface issues • Feature requests | • UX improvement • Feature development • Platform stability |
Preference-Based | Medium | • Changed habits • Alternative choices • Lifestyle shifts | • Use case expansion • Product innovation • Category addition |
Competition-Based | Medium | • Platform switching • Better offers • Unique features | • Differentiation • Market positioning • Competitive response |
Involuntary Churn (20% of Total Churn)
Category | Impact | Indicators | Prevention Levers |
Technical | High | • Payment failures • App crashes • Login issues | • Technical monitoring • Platform stability • Payment optimization |
Operational | Medium | • Service availability • Coverage issues • Partner closures | • Network expansion • Partner retention • Market planning |
Circumstantial | Low | • Relocations • Device changes • Number changes | • Data portability • Account recovery • Seamless transitions |
Negative Action Indicators
Customer Satisfaction Metrics
Metric | Warning Threshold | Critical Threshold | Action Trigger |
NPS Score | < 30 | < 20 | Immediate review |
CSAT Rating | < 4.0/5 | < 3.5/5 | Service audit |
Restaurant Rating | < 3.8/5 | < 3.5/5 | Partner review |
Delivery Rating | < 4.0/5 | < 3.5/5 | Fleet audit |
Behavioral Red Flags
Indicator | Warning Signs | Monitoring Frequency | Intervention |
Order Frequency | -30% vs normal | Weekly | Personalized offer |
Cart Abandonment | > 3 in week | Daily | Recovery campaign |
App Usage | -50% vs normal | Weekly | Re-engagement |
Category Usage | Single category only | Monthly | Cross-sell |
Support Indicators
Type | Warning Level | Action Required |
Multiple Support Tickets | • 2+ tickets in week • Similar issues repeated • Escalations | • Priority resolution • Case review • Proactive outreach |
Refund Requests | • Multiple requests • High value refunds • Pattern formation | • Quality audit • Partner review • Process improvement |
Delivery Complaints | • Time issues • Behavior concerns • Route problems | • Fleet audit • Training refresh • Route optimization |
Platform Engagement
Signal | Risk Level | Monitoring |
Feature Usage | • Limited features • Basic interaction • No exploration | Weekly tracking |
Payment Behavior | • Failed payments • Payment method removal • COD preference | Transaction monitoring |
Social Engagement | • Negative reviews • Social media complaints • Low referrals | Social listening |
Response Time Metrics
Channel | Warning Level | Critical Level |
Chat Support | > 2 min | > 5 min |
Email Response | > 4 hours | > 12 hours |
Refund Processing | > 24 hours | > 48 hours |
Issue Resolution | > 48 hours | > 72 hours |
Resurrection campaigns
Dimension | Weekday Warriors | Premium Family Experience | Night Shift Reliable | Healthy Living Express | Squad Savings |
|---|---|---|---|---|---|
Campaign Name | Back to Office Efficiency | Quality-First Family Dining | Night Owl Power Hours | Clean Eating Revolution | Campus Squad Deals |
User Segmentation | Urban professionals aged 25-35 with previous 8-10 monthly orders, ₹350 AOV, churned due to high costs, inactive for 45-60 days, primarily lunch time orderers | Suburban families aged 30-45 with 4-6 monthly orders, ₹900 AOV, churned due to quality inconsistency, inactive for 30-45 days, weekend heavy users | Tech professionals aged 22-35 with 12-15 monthly orders, ₹400 AOV, churned due to service reliability, inactive 30-40 days, late night orderers | Health-conscious professionals aged 25-40 with 6-8 monthly orders, ₹450 AOV, churned due to limited healthy options, inactive 60-90 days, regular fitness trackers | College students aged 18-24 with 5-6 monthly orders, ₹250 AOV, churned due to better competitor deals, inactive 30-45 days, group orderers |
Pitch & Content | "Your desk lunch upgraded - 50% off on curated lunch menu with scheduled delivery and corporate benefits. Maximize your lunch break efficiency." | "Experience guaranteed quality with family-sized portions from premium restaurants. Every meal perfect, or instant refund guaranteed." | "Dedicated night fleet ensuring hot food delivery within 30 minutes. Special energy bundles for your night shift fuel." | "Calorie-counted, macro-tracked meals from health-focused restaurants. Clean eating made convenient with nutrition insights." | "Group orders unlock maximum savings. Split payments, campus specials, and rewards multiplier for squad orders." |
Offer | 50% off first 5 weekday lunch orders + free ONE membership month + zero delivery fee above ₹200, valid 14 days | ₹500 off on orders above ₹1000 + quality guarantee with instant refund + premium restaurant access, valid 30 days | 40% off all night orders (11PM-4AM) + free energy drink per order + double rewards points, valid 21 days | 30% off on healthy category + free salad above ₹400 + health rewards program enrollment, valid 30 days | 60% off first group order + additional 10% for 4+ members + free delivery month, valid 21 days |
Proposed Flow | App open > Lunch pre-order prompt > Restaurant curation > Schedule selection > Corporate payment > Order confirmation | App open > Premium collection > Family bundles > Quality promise > Order placement > Active tracking | Night shift start > Energy menu > Bundle selection > Quick checkout > Live tracking > Delivery | Health category showcase > Nutrition cards > Meal planning > Order customization > Delivery | Group creation > Member addition > Menu voting > Split bill setup > Combined order > Delivery |
Frequency & Timing | Launch Monday 10AM, weekly office hour reminders, expiry alerts at 48 and 24 hours | Launch Friday 6PM, weekend prime time reminders, final weekend push | Daily 11PM reminders during campaign period, shift timing alerts | Monday launch, meal time reminders, bi-weekly health tips | Semester start launch, weekend campaign, daily evening reminders |
Success Metrics | 25% resurrection rate, 5+ monthly orders, 40% 60-day retention, 30% ONE conversion | 20% resurrection rate, 4.5/5 quality rating, 3+ monthly orders, 50% premium adoption | 30% resurrection rate, 40% night order share, 95% on-time delivery, 25% bundle take-up | 15% resurrection rate, 70% healthy category orders, 60% nutrition engagement, 25% program enrollment | 35% resurrection rate, 50% group orders, 3+ members per group, 40% weekend retention |
Input Metrics | Office location density, lunch order history, corporate email validation, payment method type | Family order size, premium restaurant coverage, quality complaint history, weekend order patterns | Night shift areas, order time patterns, energy drink demand, delivery fleet capacity | Health tag interactions, dietary preferences, fitness app connections, order customizations | Campus zones, group size history, split payment data, peer connections |
Check Metrics | Weekday order volume, subscription retention, corporate account creation, peak hour capacity | Quality ratings trend, family bundle adoption, premium restaurant coverage, weekend capacity | Night order completion rate, energy bundle attachment, delivery time compliance, fleet utilization | Healthy order frequency, nutrition info engagement, customization rate, program stickiness | Group formation rate, member addition speed, split success rate, social sharing |
Reasons | High ROI potential through habit formation, clear user need, operational efficiency during predictable hours | Highest AOV segment, strong word-of-mouth potential, quality improvements beneficial for all users | Underserved market, high frequency potential, premium pricing opportunity | Growing segment, high retention potential, brand differentiation opportunity | Viral growth potential, low CAC through referrals, high engagement metrics |
Brand focused courses
Great brands aren't built on clicks. They're built on trust. Craft narratives that resonate, campaigns that stand out, and brands that last.


All courses
Master every lever of growth — from acquisition to retention, data to events. Pick a course, go deep, and apply it to your business right away.


Explore courses by GrowthX
Built by Leaders From Amazon, CRED, Zepto, Hindustan Unilever, Flipkart, paytm & more
Course
Advanced Growth Strategy
Core principles to distribution, user onboarding, retention & monetisation.
58 modules
21 hours
Course
Go to Market
Learn to implement lean, balanced & all out GTM strategies while getting stakeholder buy-in.
17 modules
1 hour
Course
Brand Led Growth
Design your brand wedge & implement it across every customer touchpoint.
15 modules
2 hours
Course
Event Led Growth
Design an end to end strategy to create events that drive revenue growth.
48 modules
1 hour
Course
Growth Model Design
Learn how to break down your North Star metric into actionable input levers and prioritise them.
9 modules
1 hour
Course
Building Growth Teams
Learn how to design your team blueprint, attract, hire & retain great talent
24 modules
1 hour
Course
Data Led Growth
Learn the science of RCA & experimentation design to drive real revenue impact.
12 modules
2 hours
Course
Email marketing
Learn how to set up email as a channel and build the 0 → 1 strategy for email marketing
12 modules
1 hour
Course
Partnership Led Growth
Design product integrations & channel partnerships to drive revenue impact.
27 modules
1 hour
Course
Tech for Growth
Learn to ship better products with engineering & take informed trade-offs.
14 modules
2 hours
Crack a new job or a promotion with ELEVATE
Designed for mid-senior & leadership roles across growth, product, marketing, strategy & business


Learning Resources
Browse 500+ case studies, articles & resources the learning resources that you won't find on the internet.

Patience—you’re about to be impressed.